As one of the Associate Editors, I invite all Biological Anthropology students in the School of Archaeology and Anthropology at The Australian National University to submit an essay for consideration. Accepted essays will be published in the 2nd Volume of:
“The Human Voyage: Undergraduate Research in Biological Anthropology”
published by ANU e-Press. See the call for papers below.
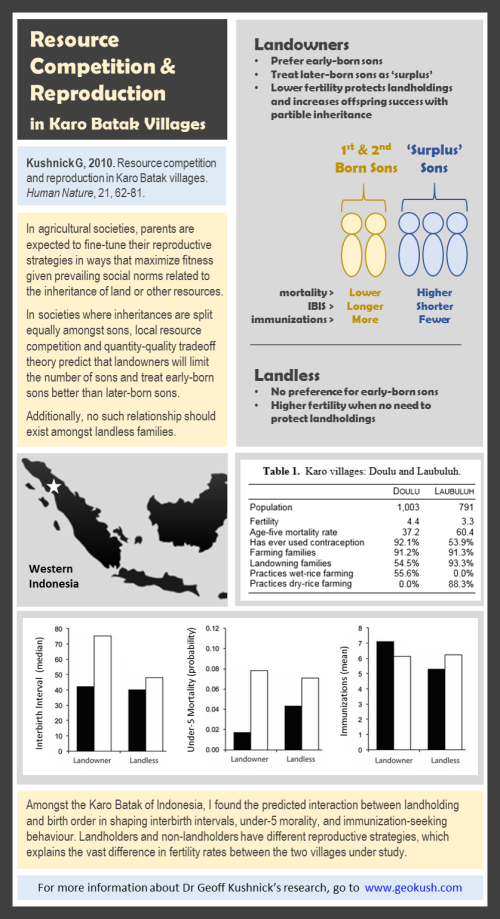
A visual abstract to my 2010 publication in Human Nature where I found that landholding status shaped reproductive strategies, both in terms of reproductive rates and the quantity and quality of care received after they were born:
Kushnick, G. (2010) Resource competition and reproduction in Karo Batak villages. Human Nature 21: 62-81. PDFLink
A false positive is a claim that an effect exists when in actuality it doesn’t. No one knows what proportion of published papers contain such incorrect or overstated results, but there are signs that the proportion is not small.
The epidemiologist John Ioannidis gave the best explanation for this phenomenon in a famous paper in 2005, provocatively titled “Why most published research results are false”. One of the reasons Ioannidis gave for so many false results has come to be called “p hacking”, which arises from the pressure researchers feel to achieve statistical significance.
What is statistical significance?
To draw conclusions from data, researchers usually rely on significance testing. In simple terms, this means calculating the “p value”, which is the probability of results like ours if there really is no effect. If the p value is sufficiently small, the result is declared to be statistically significant.
Traditionally, a p value of less than .05 is the criterion for significance. If you report a p<.05, readers are likely to believe you have found a real effect. Perhaps, however, there is actually no effect and you have reported a false positive.
Many journals will only publish studies that can report one or more statistically significant effects. Graduate students quickly learn that achieving the mythical p<.05 is the key to progress, obtaining a PhD and the ultimate goal of achieving publication in a good journal.
This pressure to achieve p<.05 leads to researchers cutting corners, knowingly or unknowingly, for example by p hacking.
The lure of p hacking
To illustrate p hacking, here is a hypothetical example.
Bruce has recently completed a PhD and has landed a prestigious grant to join one of the top research teams in his field. His first experiment doesn’t work out well, but Bruce quickly refines the procedures and runs a second study. This looks more promising, but still doesn’t give a p value of less than .05.
Convinced that he is onto something, Bruce gathers more data. He decides to drop a few of the results, which looked clearly way off.
He then notices that one of his measures gives a clearer picture, so he focuses on that. A few more tweaks and Bruce finally identifies a slightly surprising but really interesting effect that achieves p<.05. He carefully writes up his study and submits it to a good journal, which accepts his report for publication.
Bruce tried so hard to find the effect that he knew was lurking somewhere. He was also feeling the pressure to hit p<.05 so he could declare statistical significance, publish his finding and taste sweet success.
There is only one catch: there was actually no effect. Despite the statistically significant result, Bruce has published a false positive.
Bruce felt he was using his scientific insight to reveal the lurking effect as he took various steps after starting his study:
He collected further data.
He dropped some data that seemed aberrant.
He dropped some of his measures and focused on the most promising.
He analysed the data a little differently and made a few further tweaks.
The trouble is that all these choices were made after seeing the data. Bruce may, unconsciously, have been cherrypicking – selecting and tweaking until he obtained the elusive p<.05. Even when there is no effect, such selecting and tweaking might easily find something in the data for which p<.05.
Statisticians have a saying: if you torture the data enough, they will confess. Choices and tweaks made after seeing the data are questionable research practices. Using these, deliberately or not, to achieve the right statistical result is p hacking, which is one important reason that published, statistically significant results may be false positives.
What proportion of published results are wrong?
This is a good question, and a fiendishly tricky one. No one knows the answer, which is likely to be different in different research fields.
A large and impressive effort to answer the question for social and cognitive psychology was published in 2015. Led by Brian Nosek and his colleagues at the Center for Open Science, the Replicability Project: Psychology (RP:P) had 100 research groups around the world each carry out a careful replication of one of 100 published results. Overall, roughly 40 replicated fairly well, whereas in around 60 cases the replication studies obtained smaller or much smaller effects.
The 100 RP:P replication studies reported effects that were, on average, just half the size of the effects reported by the original studies. The carefully conducted replications are probably giving more accurate estimates than the possibly p hacked original studies, so we could conclude that the original studies overestimated true effects by, on average, a factor of two. That’s alarming!
How to avoid p hacking
The best way to avoid p hacking is to avoid making any selection or tweaks after seeing the data. In other words, avoid questionable research practices. In most cases, the best way to do this is to use preregistration.
Preregistration requires that you prepare in advance a detailed research plan, including the statistical analysis to be applied to the data. Then you preregister the plan, with date stamp, at the Open Science Framework or some other online registry.
Then carry out the study, analyse the data in accordance with the plan, and report the results, whatever they are. Readers can check the preregistered plan and thus be confident that the analysis was specified in advance, and not p hacked. Preregistration is a challenging new idea for many researchers, but likely to be the way of the future.
Estimation rather than p values
The temptation to p hack is one of the big disadvantages of relying on p values. Another is that the p<.05 criterion encourages black-and-white thinking: an effect is either statistically significant or it isn’t, which sounds rather like saying an effect exists or it doesn’t.
But the world is not black and white. To recognise the numerous shades of grey it’s much better to use estimation rather than p values. The aim with estimation is to estimate the size of an effect – which may be small or large, zero, or even negative. In terms of estimation, a false positive result is an estimate that’s larger or much larger than the true value of an effect.
Let’s take a hypothetical study on the impact of therapy. The study might, for example, estimate that therapy gives, on average, a 7-point decrease in anxiety. Suppose we calculate from our data a confidence interval – a range of uncertainty either side of our best estimate – of [4, 10]. This tells us that our estimate of 7 is, most likely, within about 3 points on the anxiety scale of the true effect – the true average amount of benefit of the therapy.
In other words, the confidence interval indicates how precise our estimate is. Knowing such an estimate and its confidence interval is much more informative than any p value.
I refer to estimation as one of the “new statistics”. The techniques themselves are not new, but using them as the main way to draw conclusions from data would for many researchers be new, and a big step forward. It would also help avoid the distortions caused by p hacking.
Statistics is a useful tool for understanding the patterns in the world around us. But our intuition often lets us down when it comes to interpreting those patterns. In this series we look at some of the common mistakes we make and how to avoid them when thinking about statistics, probability and risk.
1. Assuming small differences are meaningful
Many of the daily fluctuations in the stock market represent chance rather than anything meaningful. Differences in polls when one party is ahead by a point or two are often just statistical noise.
You can avoid drawing faulty conclusions about the causes of such fluctuations by demanding to see the “margin of error” relating to the numbers.
If the difference is smaller than the margin of error, there is likely no meaningful difference, and the variation is probably just down to random fluctuations.
Error bars illustrate the degree of uncertainty in a score. When such margins overlap, the difference is likely to be due to statistical noise.
2. Equating statistical significance with real-world significance
We often hear generalisations about how two groups differ in some way, such as that women are more nurturing while men are physically stronger.
These differences often draw on stereotypes and folk wisdom but often ignore the similarities in people between the two groups, and the variation in people within the groups.
If you pick two men at random, there is likely to be quite a lot of difference in their physical strength. And if you pick one man and one woman, they may end up being very similar in terms of nurturing, or the man may be more nurturing than the woman.
You can avoid this error by asking for the “effect size” of the differences between groups. This is a measure of how much the average of one group differs from the average of another.
If the effect size is small, then the two groups are very similar. Even if the effect size is large, the two groups will still likely have a great deal of variation within them, so not all members of one group will be different from all members of another group.
3. Neglecting to look at extremes
The flipside of effect size is relevant when the thing that you’re focusing on follows a “normal distribution” (sometimes called a “bell curve”). This is where most people are near the average score and only a tiny group is well above or well below average.
When that happens, a small change in performance for the group produces a difference that means nothing for the average person (see point 2) but that changes the character of the extremes more radically.
Avoid this error by reflecting on whether you’re dealing with extremes or not. When you’re dealing with average people, small group differences often don’t matter. When you care a lot about the extremes, small group differences can matter heaps.
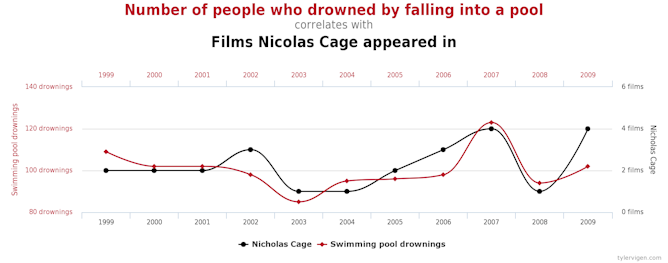
Did you know there’s a correlation between the number of people who drowned each year in the United States by falling into a swimming pool and number of films Nicholas Cage appeared in?
Is there a causal link? (tylervigen.com)
If you look hard enough you can find interesting patterns and correlations that are merely due to coincidence.
Just because two things happen to change at the same time, or in similar patterns, does not mean they are related.
Avoid this error by asking how reliable the observed association is. Is it a one-off, or has it happened multiple times? Can future associations be predicted? If you have seen it only once, then it is likely to be due to random chance.
5. Getting causation backwards
When two things are correlated – say, unemployment and mental health issues – it might be tempting to see an “obvious” causal path – say that mental health problems lead to unemployment.
But sometimes the causal path goes in the other direction, such as unemployment causing mental health issues.
You can avoid this error by remembering to think about reverse causality when you see an association. Could the influence go in the other direction? Or could it go both ways, creating a feedback loop?
6. Forgetting to consider outside causes
People often fail to evaluate possible “third factors”, or outside causes, that may create an association between two things because both are actually outcomes of the third factor.
For example, there might be an association between eating at restaurants and better cardiovascular health. That might lead you to believe there is a causal connection between the two.
However, it might turn out that those who can afford to eat at restaurants regularly are in a high socioeconomic bracket, and can also afford better health care, and it’s the health care that affords better cardiovascular health.
You can avoid this error by remembering to think about third factors when you see a correlation. If you’re following up on one thing as a possible cause, ask yourself what, in turn, causes that thing? Could that third factor cause both observed outcomes?
7. Deceptive graphs
A lot of mischief occurs in the scaling and labelling of the vertical axis on graphs. The labels should show the full meaningful range of whatever you’re looking at.
But sometimes the graph maker chooses a narrower range to make a small difference or association look more impactful. On a scale from 0 to 100, two columns might look the same height. But if you graph the same data only showing from 52.5 to 56.5, they might look drastically different.
You can avoid this error by taking care to note graph’s labels along the axes. Be especially sceptical of unlabelled graphs.
BIOLOGICAL ANTHROPOLOGY RESEARCH BAR SEMINARS 2017
Thursdays 4pm, Jean Martin Room, Level 3 Beryl Rawson Building 13
February 23rd Dr Rita Hardiman
University of Melbourne
The Melbourne Femur Research Collection: From forensic anthropology to multi-disciplinary research collection of international significance
March 2nd Megan O’Donnell
Australian National University
The Phoenix Cohort: The effects of bushfire stress in utero
March 16th Dr Tanya Smith
Griffith University
How teeth shed light on our evolutionary past
March 23rd Prof Robert Brooks
University of New South Wales
The value of rarity in sexual behaviour
April 6th Dr Vicky Melfi
Taronga Conservation Society Australia
Behavioural Biology title TBC
May 4th Clare McFadden
Australian National University
Parturition Scars
May 18th Dr Emiliano Bruner
Centro Nacional de Investigación sobre la Evolución Humana, Spain; and University of Colorado, US
Fossils, skulls, and brains: bridging paleoneurology and medicine
July 27th Dr Siân Halcrow
University of Otago, NZ
The once forgotten child in bioarchaeology: developments in the field
August 17th Dr David Coall
Edith Cowan University
The crucial role of the early psychosocial environment in human reproductive developmental plasticity: an evolutionary perspective
August 31st Dr Alison Behie
Australian National University
Human and primate adaptations to changing environments
September 21st Dr Cyril Grueter
University of Western Australia
Sexual selection and primate multilevel societies
October 5th Dr Caroline Bennett
Victoria University of Wellington, NZ
What do we do when we dig up mass graves?
October 19th Dr Varsha Pilbrow
University of Melbourne
The Great Ape Dental Scoring System and a single case-study of its application to human evolutionary research
Job no:515459 Work type:Fixed Term Location:Canberra / ACT Categories:Academic
Classification: Academic Level B Salary package: Level B: $91,541 – $104,254 per annum plus 17% Superannuation Term: Full time, 3 years fixed term
Position overview
The School of Archaeology and Anthropology in the ANU College of Arts and Social Sciences is seeking to make a 3 year fixed term appointment in biological anthropologist specialising in primatology to contribute to its research and teaching program, commencing in July 2017. We seek to appoint a lecturer with an active commitment to research, who is able to translate that research interest into lively and engaging courses taught at the undergraduate level and above, and to supervise postgraduate research students. That person will be able to demonstrate energy and expertise in teaching, research and publication, at an early-career level.
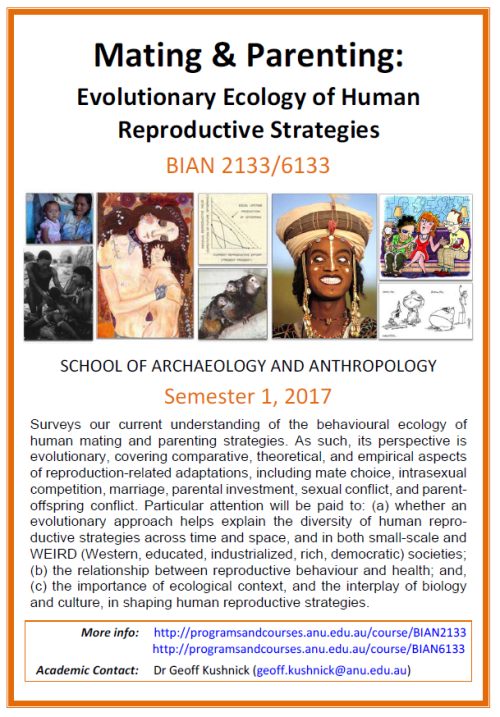
The 2016 academic year is coming to a close here at The Australian National University. Five semesters under my belt, and I feel like I’m finding my groove. We’re starting to advertise our classes for Semester 1 of the 2017 academic year, starting in February, so I thought I’d share the posters for the two classes I’ll be teaching.
I’m very excited to be teaching two courses so closely related to my research interests and expertise in human behavioural ecology in the same semester. You bet I’ll be talking a lot about my own research in these courses:
Do either of these classes sound interesting to you? If so, I’d love to have you. As always, I’ll be keeping my eye out for star performers ready to join the ranks of my honours, masters, and PhD students!
Why do men and women look for different things in a significant other? What can the behaviour of other animals tell us about human behaviour? Are popular books on the topic oversimplified? Or can we learn something of value from them?
The students in my course at The Australian National University explored these issues and others, while sharing their critical evaluations of popular literature on human evolution this week in a Poster Faire.
They produced the posters as a requirement for the course ‘Sexual Selection and Human Evolution’ (BIAN 2132/6132).
And they had great fun doing it! The course’s 56 enroled students were split into 3 groups. Each group presented for 1 hour, and then each student came to serve as the audience for one of the other hours. And, the students enjoyed it:
“The poster faire really served as an interactive platform where students were able to give their perspectives on some very interesting topics and was a fun way to dive deeper into the course material. I definitely gained new insights and really have been persuaded to read some of the books that were presented. ” – Inez Derkx
Click here to see the Poster Faire Gallery — high-resolution images of posters, and some additional photos of the Poster Faire and the participants.
In graduate school the work load increases and students will find that they are expected to master two to three times the material that they were used to as an undergraduate. This can be intimidating to the point of overwhelming a student into paralysis. Following these tips should help you master your readings instead of allowing the readings to master you!
1. Read Strategically, Not Linearly. Reading for graduate school is different than reading a book for pleasure. When we read for pleasure we often start at the beginning of the book, reading carefully in a linear fashion. If you do this with your academic material, it will take twice as long and it is likely you won’t retain the right kind of information from the reading. Instead of reading linearly, read strategically. As an academic reader your job is to mine the text you are reading for information. …
Evolutionary anthropologist with expertise in human behavioural ecology. Research interests include human reproductive strategies, evolution of social norms and institutions, quantitative methods and analysis, and the peoples of SE and the Pacific.


